Why this matters: California’s housing inventory no longer is a good match with the income of its young households. Income inequality is a captive of the economy, punishing today’s demographics as tenant household debt adds a decade or more onto the jump into homeownership.
Updated August 3, 2026.
California’s household demographics
The fuel for California’s housing market is new household formation, reliant not just on population growth, but on that population’s access to quality jobs, sufficient income and adequate mortgage funds.
Here’s today’s typical California household makeup as of 2024:
The chart on the left shows the share of California households by size. The chart on the right breaks this down further to show the characteristics of the head(s) of the households.
Nearly half of households in California are headed by married couples. Roughly one in four consists of a single person living alone. The rest are made up of those living with non-relatives (roommates or cohabiters) and individuals heading family households with no spouse present (single parents, adult children taking care of elderly parents, etc.).
These percentages are largely unchanged since the last decade, despite the brief jump in household size following the Great Recession when family members consolidated households to save money.
However, a greater change is underway nationally. California leads the country in many areas. Surprisingly, this also includes household makeup. Currently, fewer households are made up of married couples, and more people are living on their own.
The average U.S. household now resembles California with:
46.7% of U.S. households consisting of married couples, now below the 48.4% in California; and28.8% of U.S. households are single-person households, above the 24.3% in California.
California’s unique housing needs
The Golden State’s tendency toward single-person households ultimately translates to a need for more housing units per individual here in California. Further, these housing units look different than the housing units of most married couples, as single-person households generally:
make less money than married households; andoccupy less space than married couples.
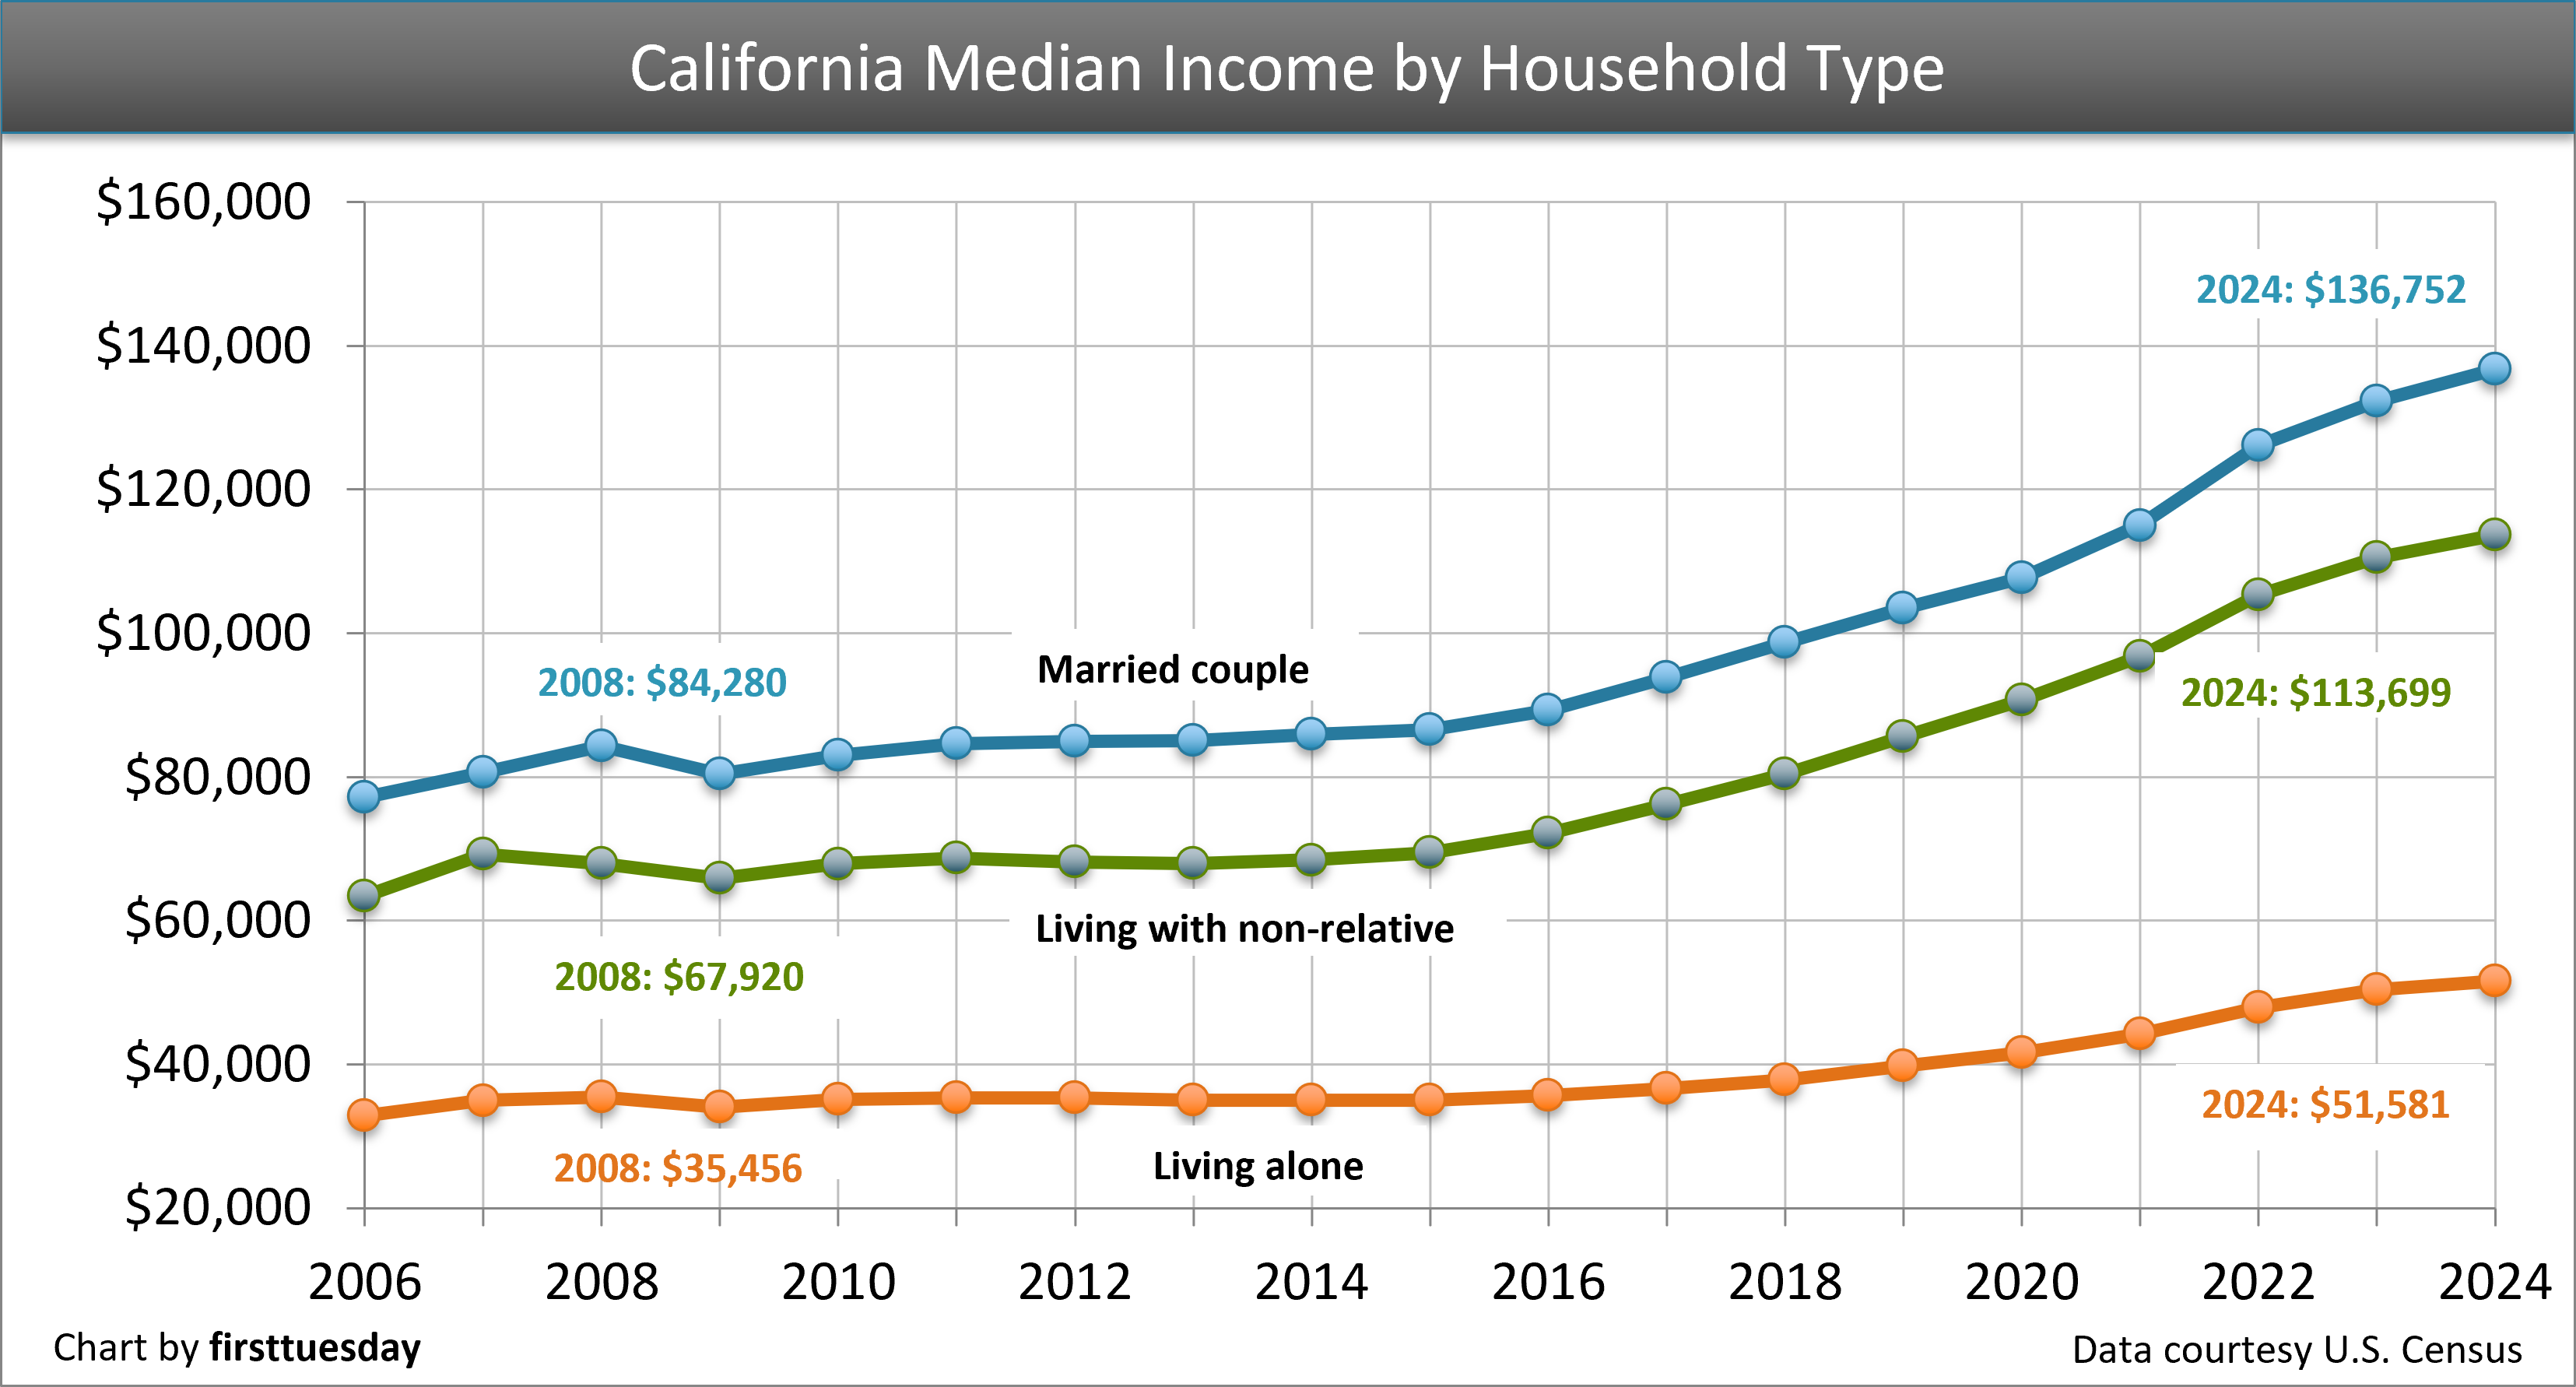

Chart update 7/31/26
20242023Annual changeMarried couple$136,800$132,200+3.4%Living with non-relative$113,700$110,500+2.9%Living alone$51,600$50,400+2.3%
Editor’s note — The dollar amounts shown above are the median income of California residents calculated by the census using an average of male and female householders living alone or with nonfamily members.
The average single-person living alone earns 38% of what married couples living together make. And that’s not just because in many married households both couples work — households consisting of non-relatives living together (that are just as likely to feature multiple workers) earn 83% of what the average married couple household makes. This suggests that married individuals trend toward higher earnings, one reason being the tendency to wait until financial stability before marrying, creating a self-selecting category of high earners.
While California has a need for more housing to accommodate single-person households, these “extra” housing units are likely less costly multi-family dwellings, including condominiums and rental apartments.
These adults born in the 1980s and 1990s are often found in urban centers, living with roommates, renting rather than owning. The average homeownership rate for Californians 34 years and younger is only 30%-40%, depending on specific age. Before the Great Recession, the homeownership rate for this age group was five to ten percentage points higher.
Today’s depressed homeownership rate amongst young people translates into a lot of lost home sale transactions. Real estate agents now wait for these transactions while younger generations slowly accumulate the savings and income needed to qualify for adequate mortgage funding to acquire an acceptable quality of housing for ownership.
Smaller paychecks, smaller houses
It’s easy to wave away Millennial and Gen Z plight as a young person’s problem (tough given that Millennials are now reaching 45-years-old), or a blip in an otherwise healthy labor force here in California. In truth, average incomes have been falling behind in California since long before Millennials came of age, stagnating household formations and in turn weighing down home sales volume for builders and agents.
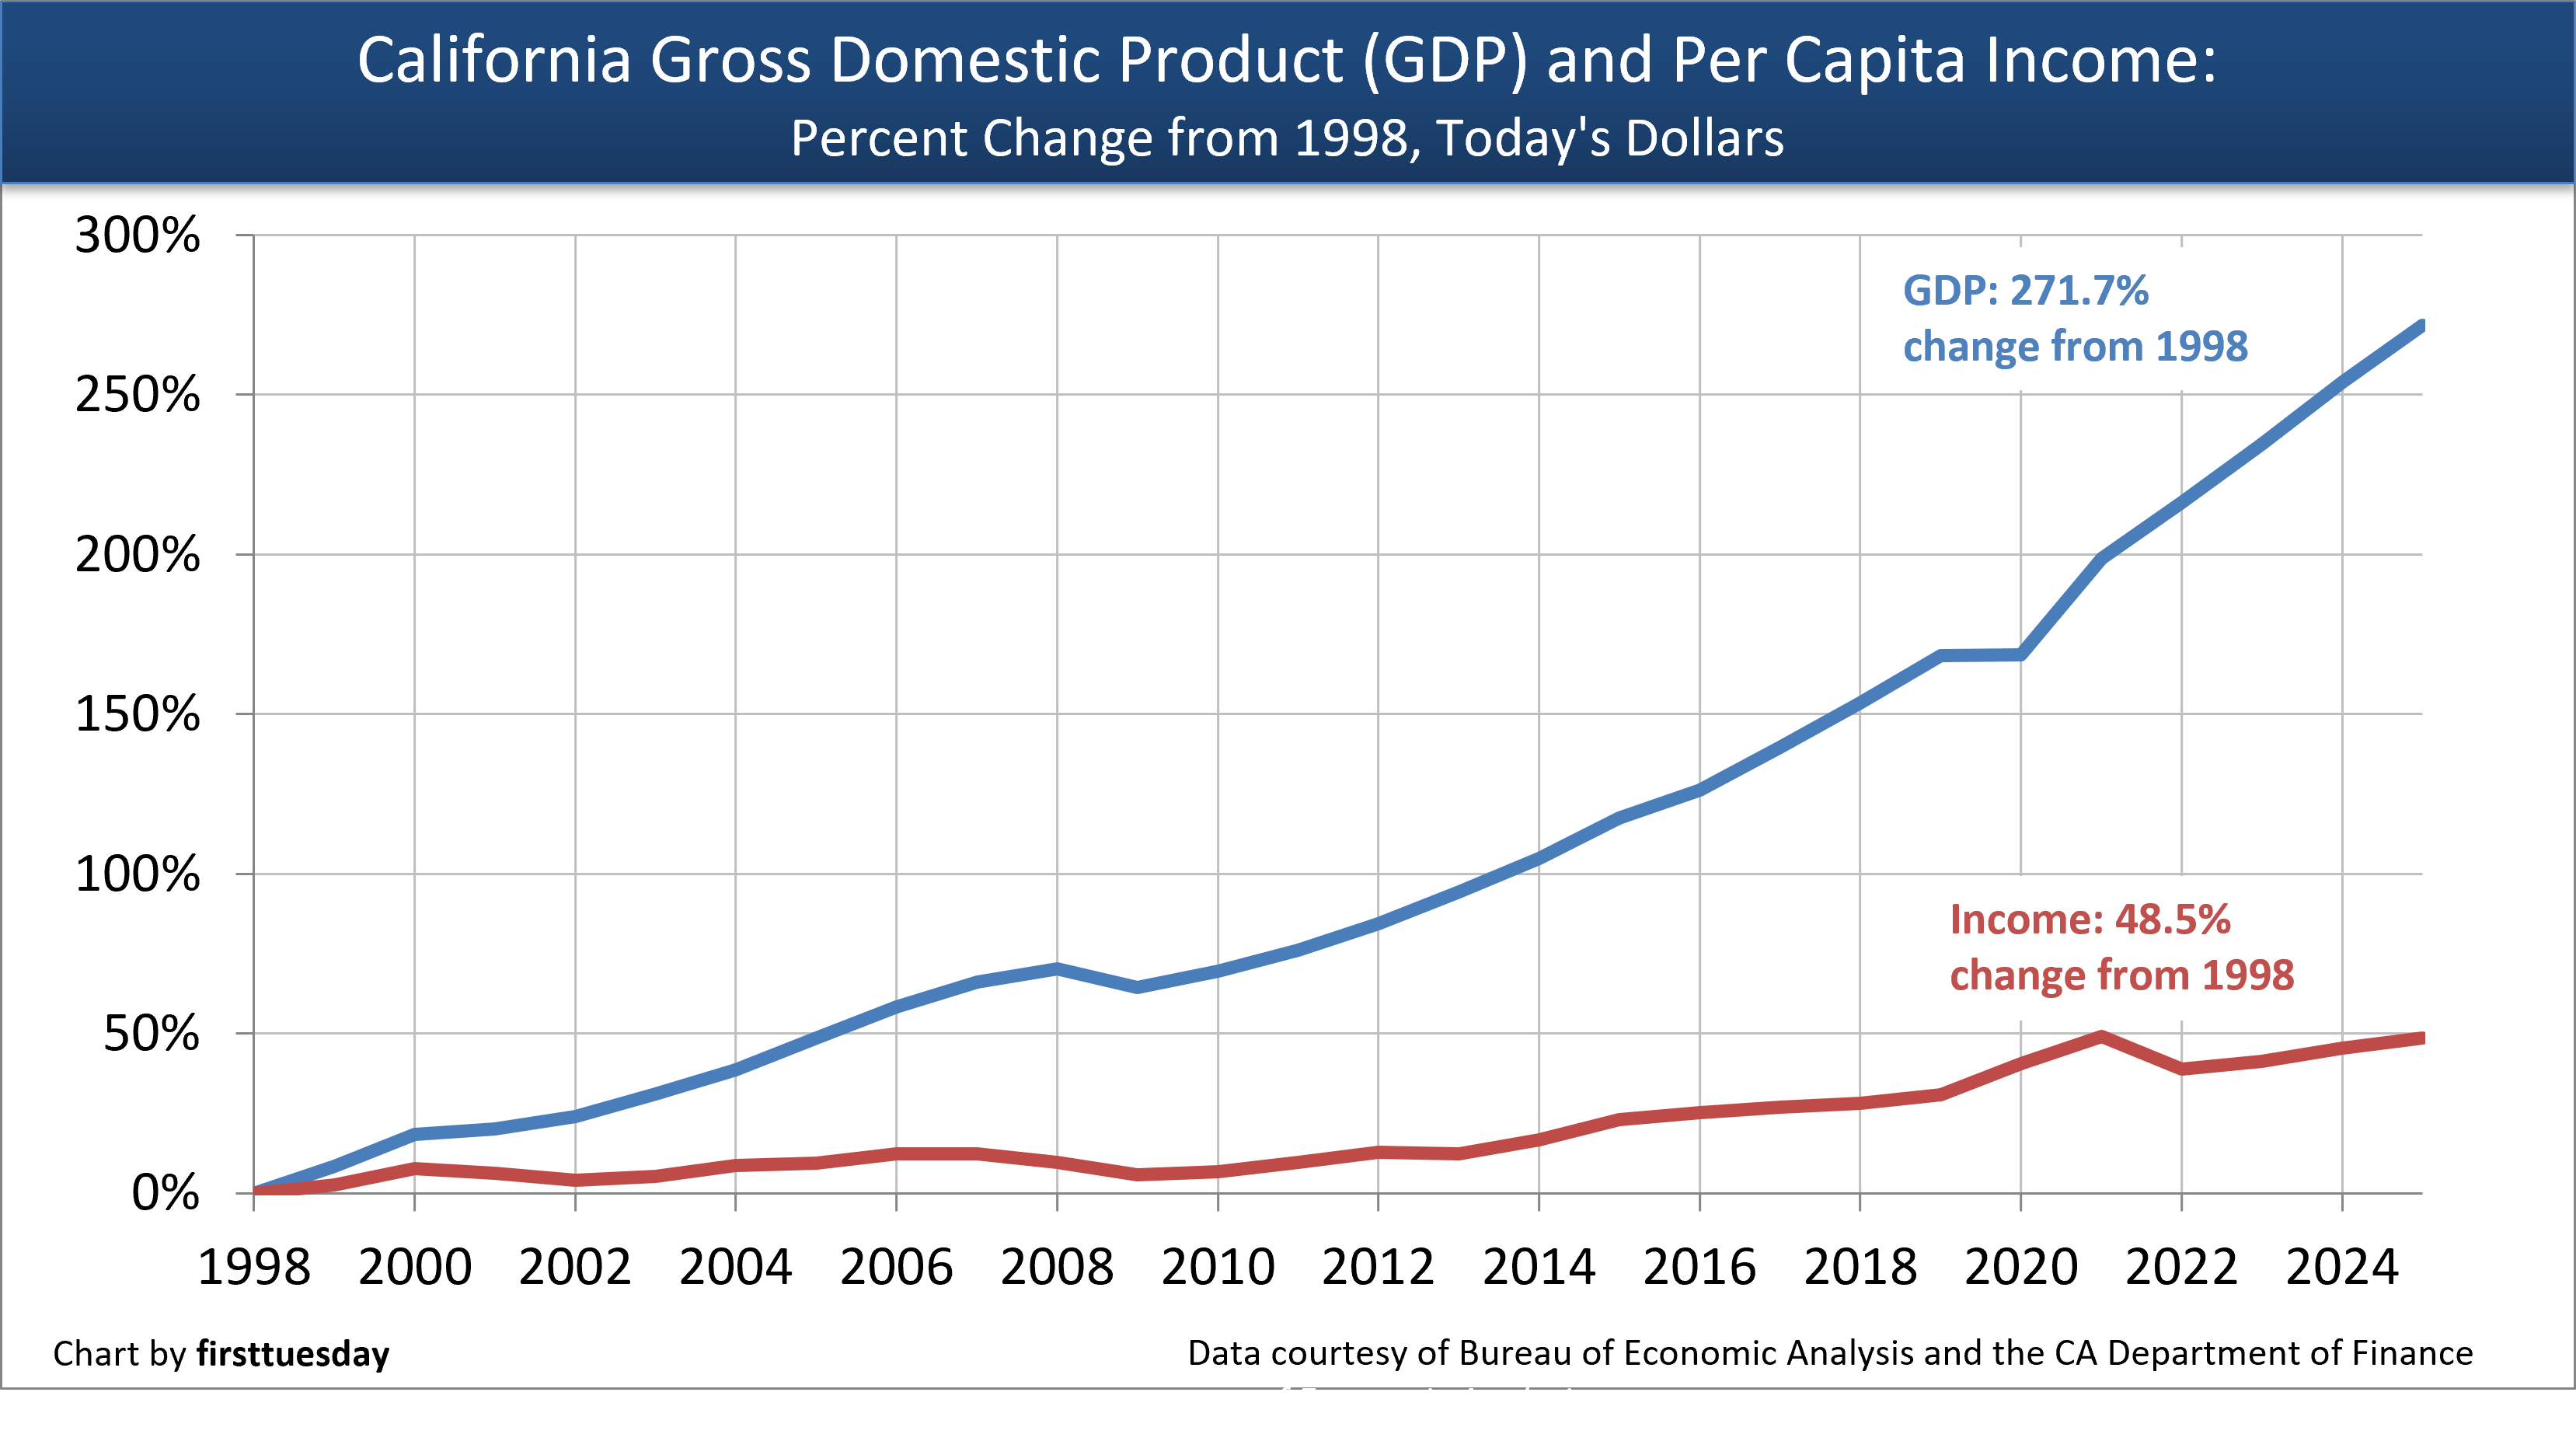

Accounting for inflation, California’s gross domestic product (GDP) increased by 271.7% from 1998-2025, at $4.25 trillion in 2025. During the same time, average per capita income in California rose 48.5%. As the GDP grew at a rate of five times worker’s income growth, the inequality problem in our society increases since stockholders, not workers producing goods and services comprising the GDP, are the beneficiaries with priority.
GDP is the measure of a state’s total economic output, and a general indicator of broad financial health. However, it clearly doesn’t translate directly to worker income growth.
A very small amount of the difference can be accounted for things like indirect business taxes and bad debts. But the bulk of the difference is due simply to a few individuals profiting disproportionately to most earners — a situation known as income inequality.
Income inequality: bad for the economy, bad for housing
Here in California, the average income of the top 1% of earners hit a record share of total earnings from all sources in 2021. Earnings of the bottom 90% of all earners that same year hit a historic low, according to the Economic Policy Institute.
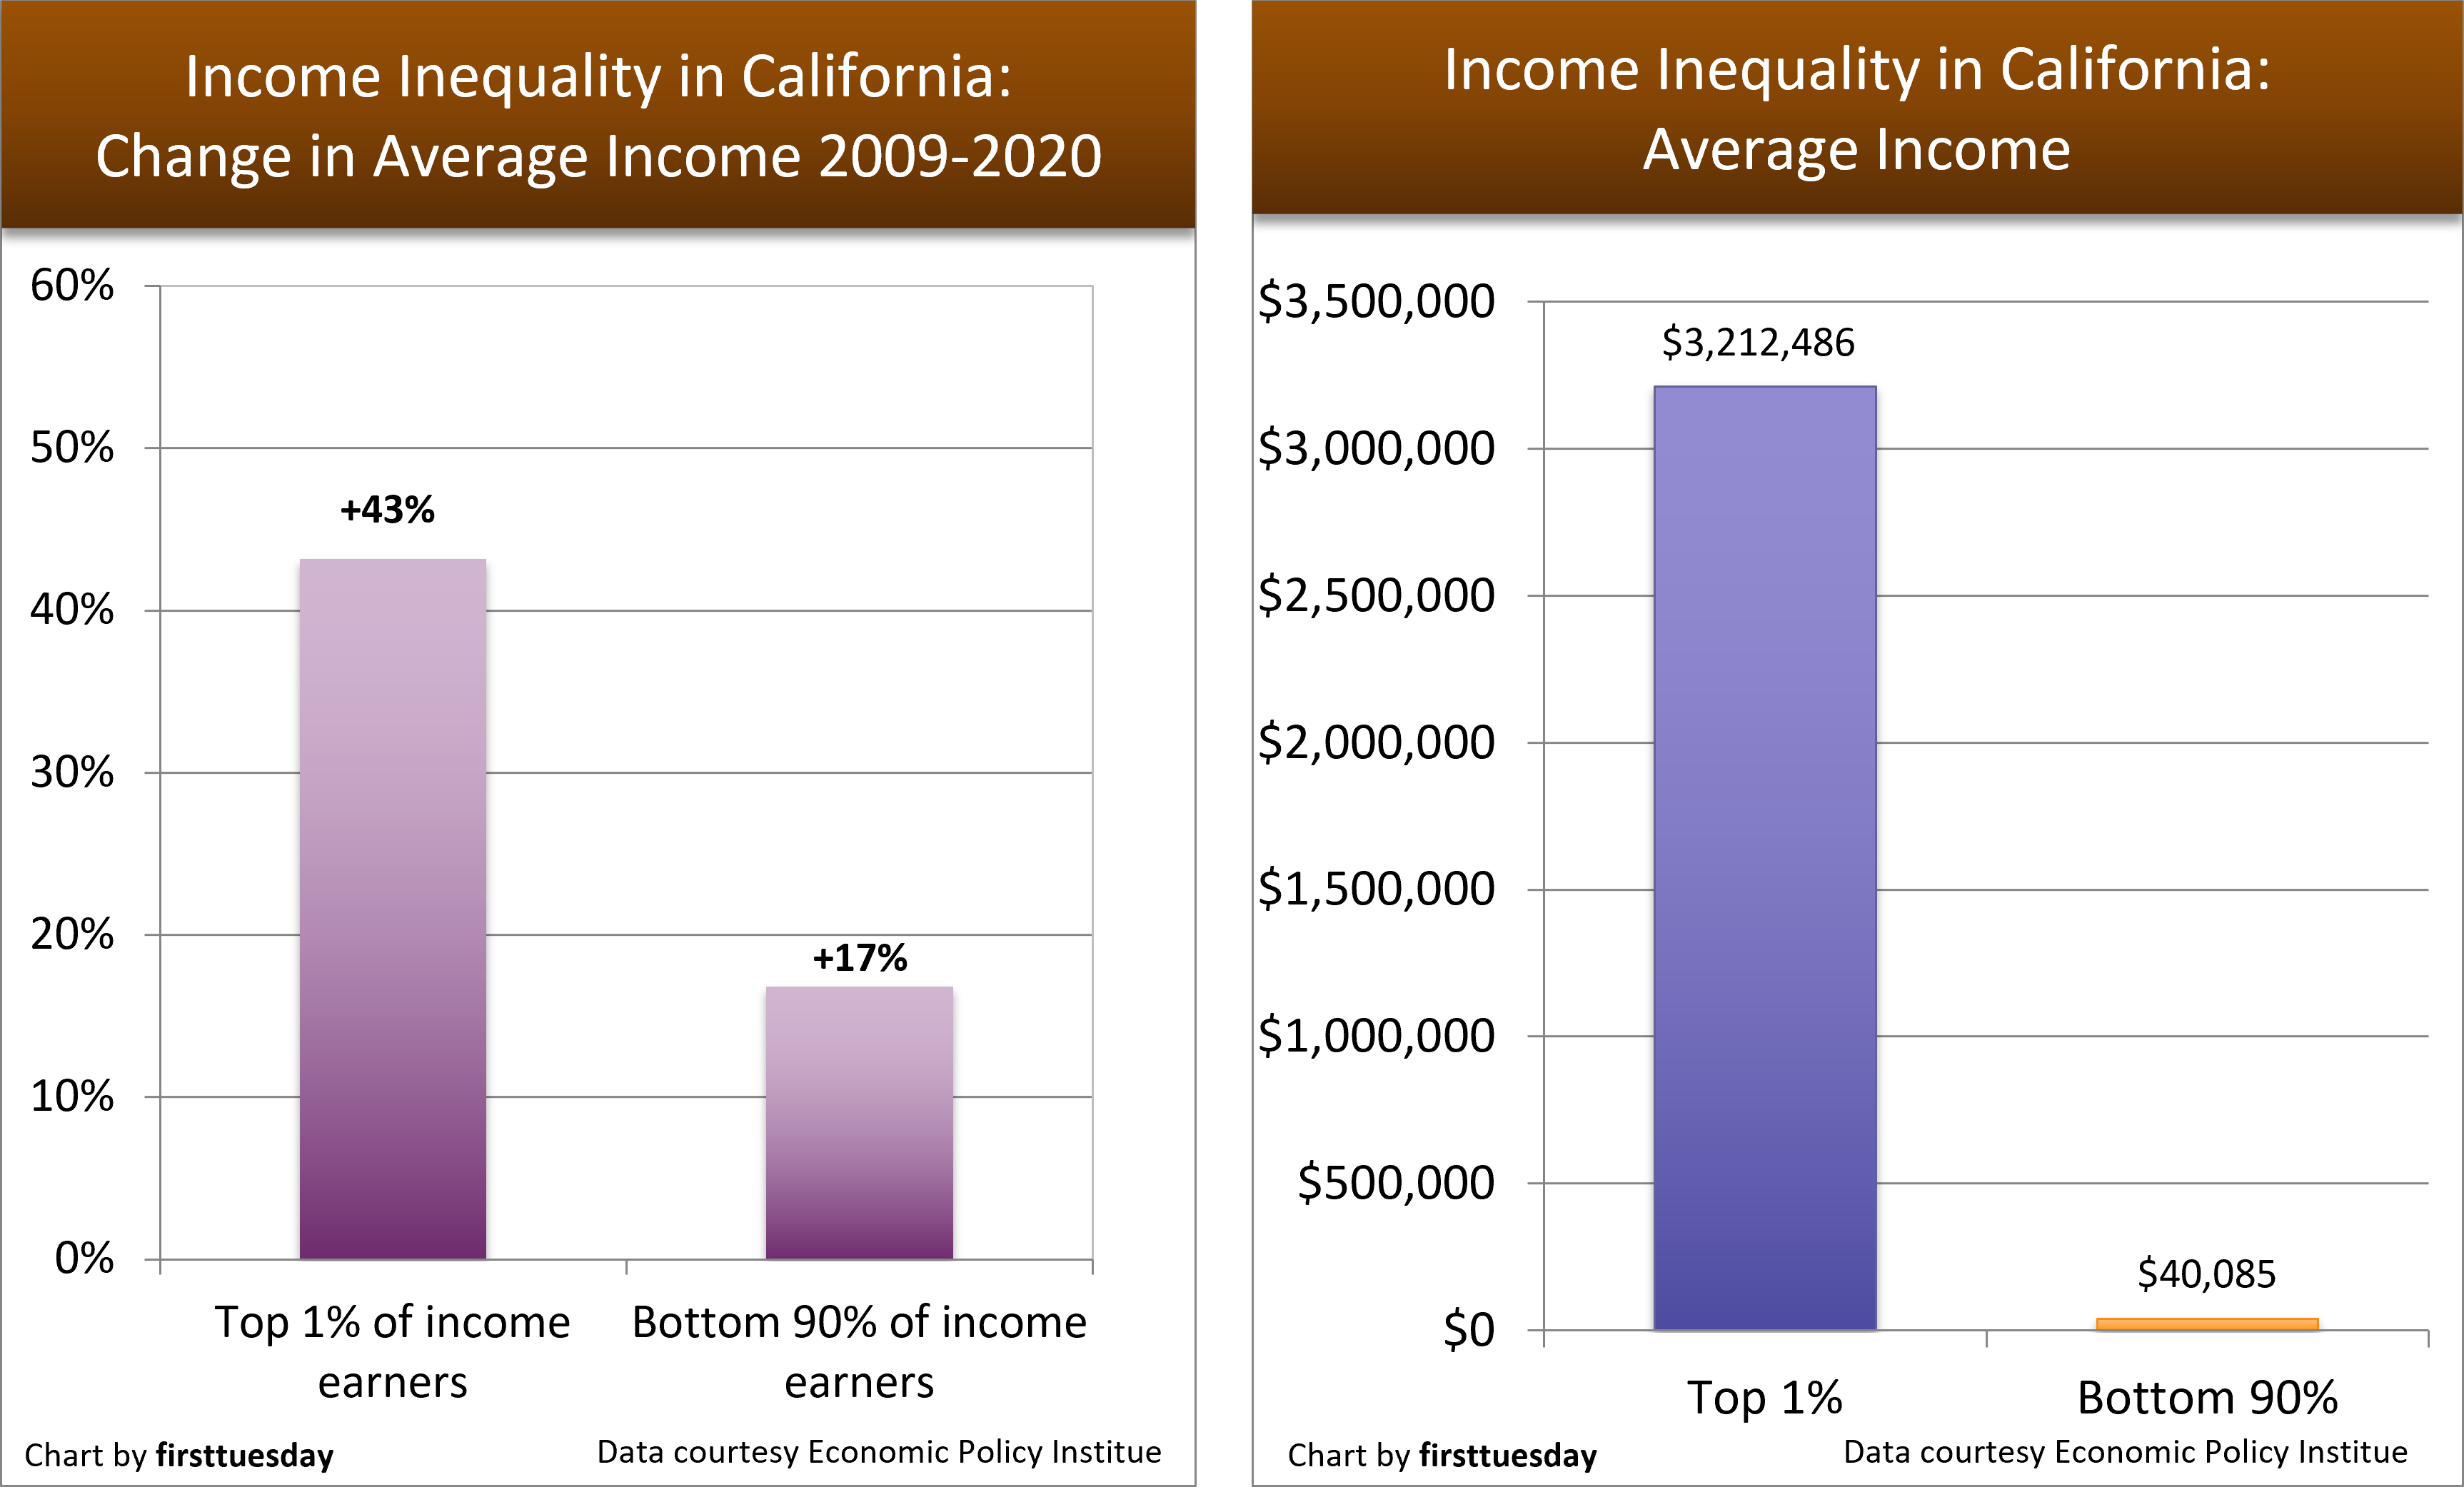

Income inequality is not only bad for most income earners; it’s also bad for the economy. In fact, without today’s high level of income inequality in California and the U.S., GDP would actually be significantly higher, according to an Organization for Economic Cooperation and Development study on the link between GDP and income inequality.
Another way to weigh the effect of income inequality on the housing market is to consider the housing demands of 99% of California’s workers against the top 1%. Sure, the top 1% of earners will buy more expensive homes and often buy a vacation home or two on top of their primary residence. They may even become property investors, buying dozens of income properties.
But that is not even a drop in the bucket compared to the housing needs of the 99-percent-ers, which today equals roughly 18.1 million working individuals in California. When profits are distributed just a little more evenly, the purchasing power of the bottom 99% rises. This causes a considerable positive effect on the housing market, as workers can qualify for higher mortgages or rents, and household formation increases as individuals finally gain the income needed to move out on their own.
Share the wealth
Policy changes affecting income inequality usually take the form of changes to the tax code which effectively sets up the transfer of revenue. However, these wealth taxes seem unpopular as they gather a lot of noise — despite the truth that:
the vast majority of households are well out of danger of ever being subject to such wealth taxes; andthe super wealthy are no more worthy of protection from taxes than regular taxpayers, though this is currently the case.
Don’t misunderstand. The top 1% of income earners are neither “bad” people nor purposefully keeping profits out of the hands of employees. But there’s no denying our tax code has fully evolved to favor the wealthy.
For regular income earners, it’s mandatory to give 10%-28% of annual income to the federal government in income taxes each year, on top of sales taxes (tariffs) for necessities and state income taxes. For the top income earners, the tax rate is a historically low 37%. Further, due to lobbied for tax loopholes designed to favor the wealthiest taxpayers, the paid rate ends up much lower.
Some changes that can level the playing field between the superrich and income earning workers are:
raising the limit on one of the biggest income tax loopholes — capital gains — currently set at just 20% for the highest income tax bracket. It’s an easy argument to make as no study finds evidence to prove a correlation between lower capital gains and higher economic growth;revising California’s Proposition 13 (Prop 13), which places a hugely disproportionate tax burden on new homeowners, for whom a five-or ten-year 50% exemption needs consideration;revising rules covering 1031 transactions, which allow real estate investors who own income producing property, but not farmers, to put off incurring any capital gains tax on a sale simply by completing a 1031 replacement property plan; andadjusting the mortgage interest deduction (MID), which overwhelmingly benefits top income earners, and perhaps instead focus on debt reduction (think student loans as a GI bill funded payoff) for those agreeing to become homeowners.
Do this, and you’ll see more workers — the 99% — making it into the middle- and upper-class. You’ll also see a higher, self-sustainable homeownership rate. California’s homeownership rate is consistently ranked near the bottom of the nation, at 55.7% going through 2026.
Uphold the status quo, and you’ll continue to see the rift widen between the top income earners and average earners. GDP growth won’t realize its full potential, large corporations will flourish and small businesses will struggle. And in return, the rich, well, get richer on the attractiveness for the enterprise we all helped make as California.